http://images.google.com/imgres?imgurl=http://proceedings.esri.com/library/userconf/proc99/proceed/papers/pap171/p1716.jpg&imgrefurl=http://proceedings.esri.com/library/userconf/proc99/proceed/papers/pap171/p171.htm&usg=__rQ09SXfNMLUqlQ1b1d2-a0IMo0o=&h=367&w=637&sz=59&hl=en&start=22&um=1&itbs=1&tbnid=rkp5MWC3Au-0IM:&tbnh=79&tbnw=137&prev=/images%3Fq%3Dbivariate%2Bchoropleth%26start%3D18%26um%3D1%26hl%3Den%26client%3Dfirefox-a%26sa%3DN%26rls%3Dorg.mozilla:en-US:official%26ndsp%3D18%26tbs%3Disch:1
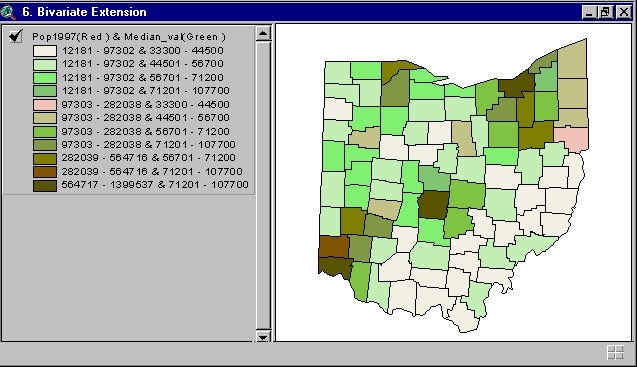
Bivariate choropleth maps display two variables on a single map by using different symbols for each variable. This specific bivariate map represents the 1997 population and also the median house values. The darker colors represent both the higher population and higher median house value.
No comments:
Post a Comment